Creating a Custom Report
You can create custom reports.
ITM On-Prem (ObserveIT) enables you to create reports customized to your own requirements.
-
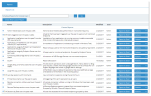
In the Web Console, click the Reports tab.
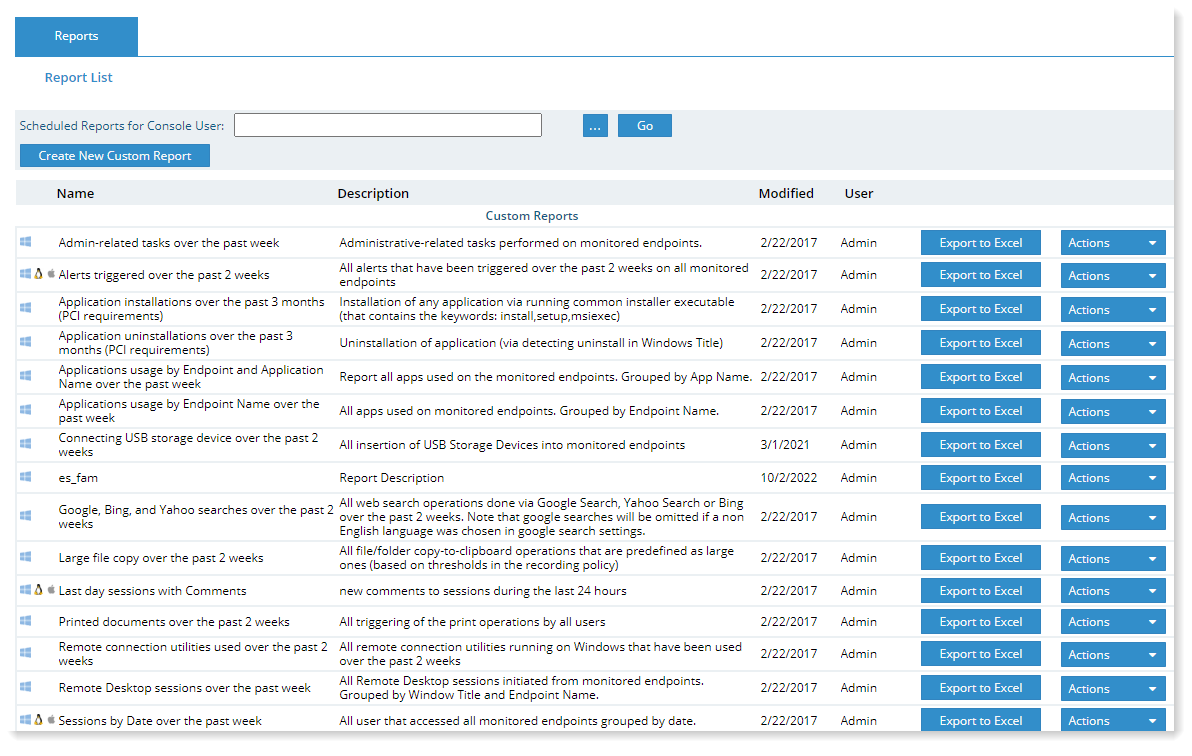
The Reports List page opens, displaying a list of the configured reports.
-
Click the Create New Custom Report button.
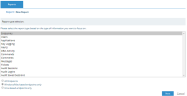
The Report Configuration Wizard opens, displaying a list of all the types of reports you can create. For more information about the types of reports, see Report Types.
-
Select the report type you want, for example. Applications.
-
Select the platform that you want the report to focus on. (By default Windows/Mac-based endpoints only is selected).
-
Click Next.
Column selection data displays.

Selecting Data to Include in the Report
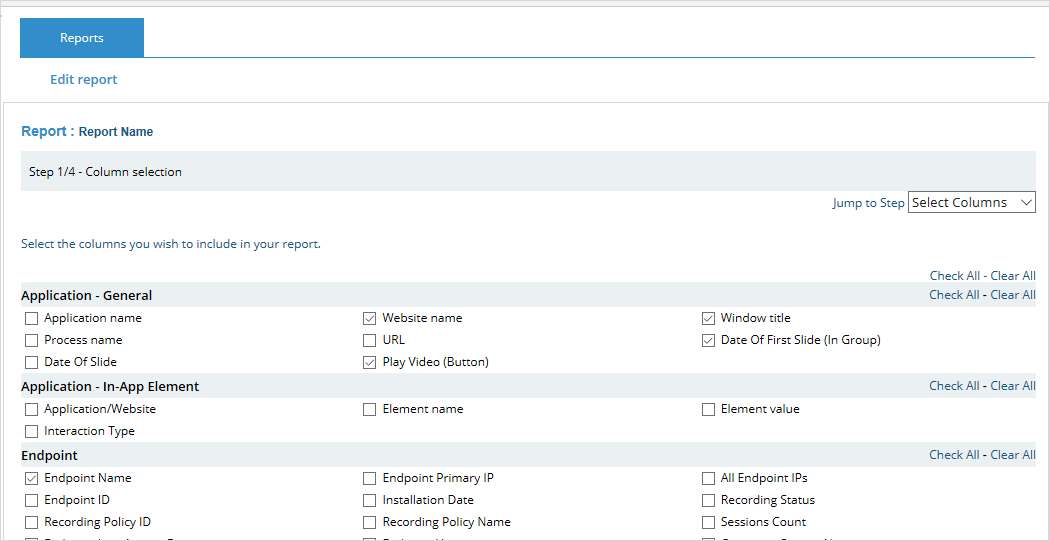
After selecting a report type, select the columns you want to show. (Step 1/4 Column selection) The columns available depend on the type of report you selected.
For details about the column selection data, see:
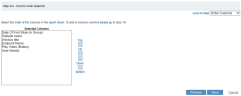
The example below shows columns and the default column order for the Applications type report.
-
Select the columns you want to display in your report.
In the example:
-
Under Application - General, select Website Name, Window title, Date of First Slide (in Group), and Play Video (Button).
-
Under Endpoint, select Endpoint Name.
-
-
After selecting the columns to display, click:
-
Next: to continue to Grouping selection
You can select where you want to go from the Jump to Step drop-down list located at the top of the page
-
Preview: to take a look at your report at this point
-
Save: to save the report you've created so far
-
Specifying How the Report Result Grouping
Specify how the information you want is to be grouped (Step 2/4 Grouping selection). In addition, specify sort order (ascending / descending).
Grouping options depend on the type of report. For example, Endpoint reports can be grouped by server, session, or user elements.
-
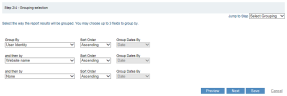
Select how you want to group the results and the sort order.
In the example below, results are grouped by User Identity, and then by Website Name, in Ascending order.
-
Click Next to continue to the Filtering selection.

Selecting the Date and Filtering
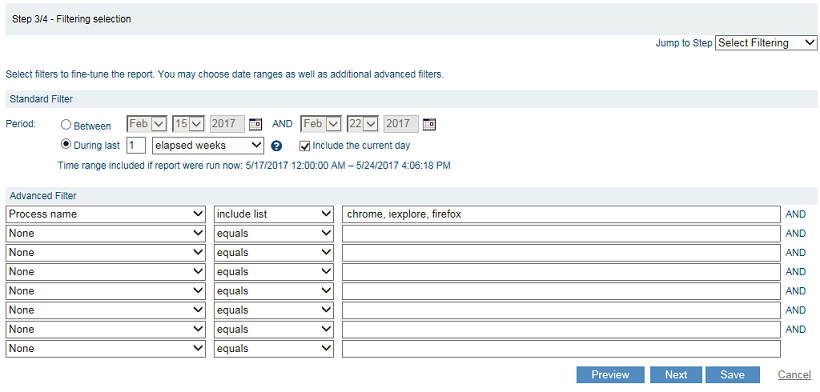
Select the date range for the report and define advanced filters to fine-tune your report (Step 3/4 Filtering selection).
-
To define the date range for the report, in the Standard Filter section, select the relevant Period option:
-
Select Between and specify the start and end dates of the report, or
-
Select During last, and specify the number of elapsed or calendar days/weeks/months/years (or calendar quarters). When you select any of the "elapsed" options, you can also specify whether or not to include the current day (note that it is selected by default).
-
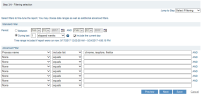
- To define the advanced filters, in the Advanced Filter section, select the column items (see Selecting the Report Type), select the required operator, and specify the required values in the text field. You can define up to 8 advanced filters for your report.
-
For this example, you can specify the names of the processes that were running while the user was interacting with the application/website.
-
From the Advanced Filter drop-down list showing all the available fields, select Process name.
-
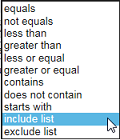
From the list of available operators, select include list which allows you to display report data for each value that you enter in the text field. (If you select exclude list, data will be displayed for any value which is not included in the list.)

-
Enter the required processes (in this example, chrome, iexplore, firefox) separated by commas.
Important Notes:
-
The options available in the Advanced Filter lists include ALL fields, even those that were not selected in Step 1/4 Column selection.
-
Using the wildcard character "%" in the beginning of a filter phrase means that the filter will ignore anything before the text you used.
-
Using the character "%" at the end of a filter phrase means that the filter will ignore anything after the text you have used. For example: %Remote% - will include results such as "Routing and Remote Access Server Setup Wizard", "Routing and Remote Access", "Remote Desktop Connection", and so on.
-
A comma (",") can be used as a separator in order to define a filter with multiple strings in OR mode (not AND mode). In other words, the reports generator will output records that comply with any of the words that are separated by a comma.
-
- At this point, you may want to click the Preview button and view the results of the report, making modifications to the filter, as needed. When finished, click Next.
It is recommended that you disable pop-up blockers for the Web Console when using Preview.
Configuring the Order of the Report Columns
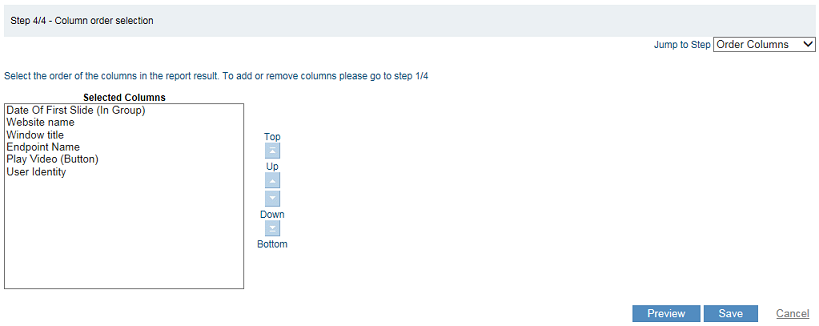
Configure the order of the report columns (Step 4/4 Column order selection) .
- Click the Top, Bottom, Up, Down buttons, to choose the order of the columns and configure the appearance of the report. The list contains the same columns that were selected in Step 1.
- Before saving the report, you can click the Preview button to view the results of the report, to make modifications to the filter, as needed. If required, you can go back to the first step and modify your settings. When finished, click the Save button.
- Provide a name and a description (optional) for the report.
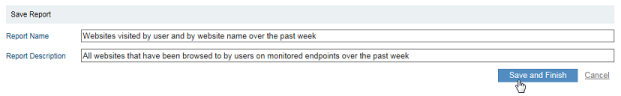
- Click Save and Finish.
The newly-created report will appear in the Report list. You can run it, edit it, copy it to create a new report with the same settings (useful when you need to make a small change in the report but do not want to go through all the steps of a it from scratch), or delete it.

See the following topics for details on how to:
-
Schedule a report to run at specific intervals, and email the results to SMTP aliases
-
Copy a report for editing or to use as a basis for other custom reports