Running Reports
This topic describes how to run a report and view the results in a separate webpage.
This topic describes how to run a report and view the results. From version 7.14 it is recommended that you download the report to Excel. Downloading to Excel is efficient and allows you to generate larger reports. (You can still see the results in a separate Web page.)
Running reports can generate additional CPU and resource usage on the SQL server holding the ITM On-Prem (ObserveIT) Database. To prevent this overhead while the server is working, you should try to run reports that might cause very large queries (such as, reports that span a long period of time) during non-working hours. To help mitigate CPU and resource usage overhead, you can view cached reports that were run previously, instead of re-running them. In the Report List, by clicking the Cached link next to a report that was previously run, you can view the report's previous results. If a report was never run before, the Cached link will be disabled.
To run a report and Export to Excel (Recommended)
From version 7.14.0, exporting to Excel is the recommended way to generate reports with large amounts of data.
If you use this option, dates are formatted as serial numbers. You can reformat them in Excel.
-
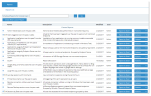
In the Reports tab, click Export to Excel link next to the report that you want to run.
For example:
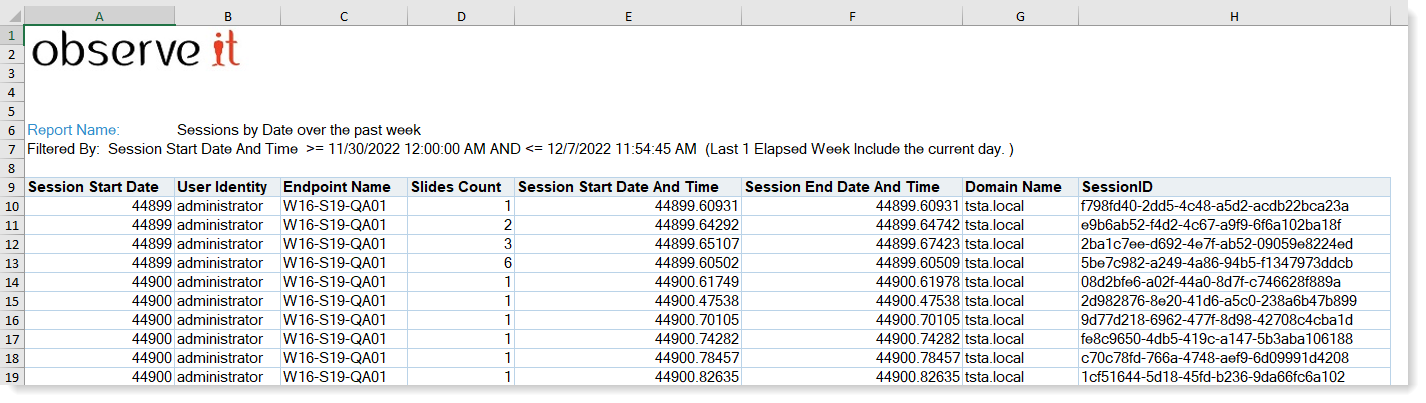
Within a short time (depending on the type and range of report), the report is generated. The results are displayed in an Excel Spreadsheet.
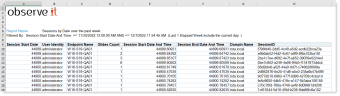
The information is displayed according to the column selection, grouping of results, session date range, and ordering of columns, that were defined during the creation of the report using the Report Configuration Wizard (see Creating a Custom Report).
-
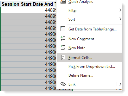
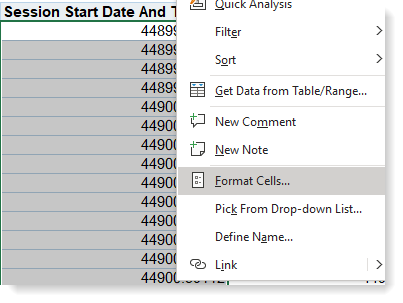
If the report includes dates, you'll probably want to reformat them. In Excel, select the column with dates. Left-click and select Format Cells from the menu.
-

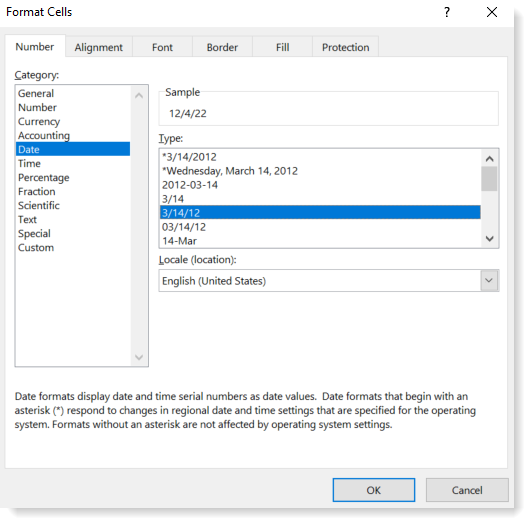
In the Format Cells dialog box, select Date and choose the format you want. Click OK.
To run a report, view the report details, and launch a video session replay
-
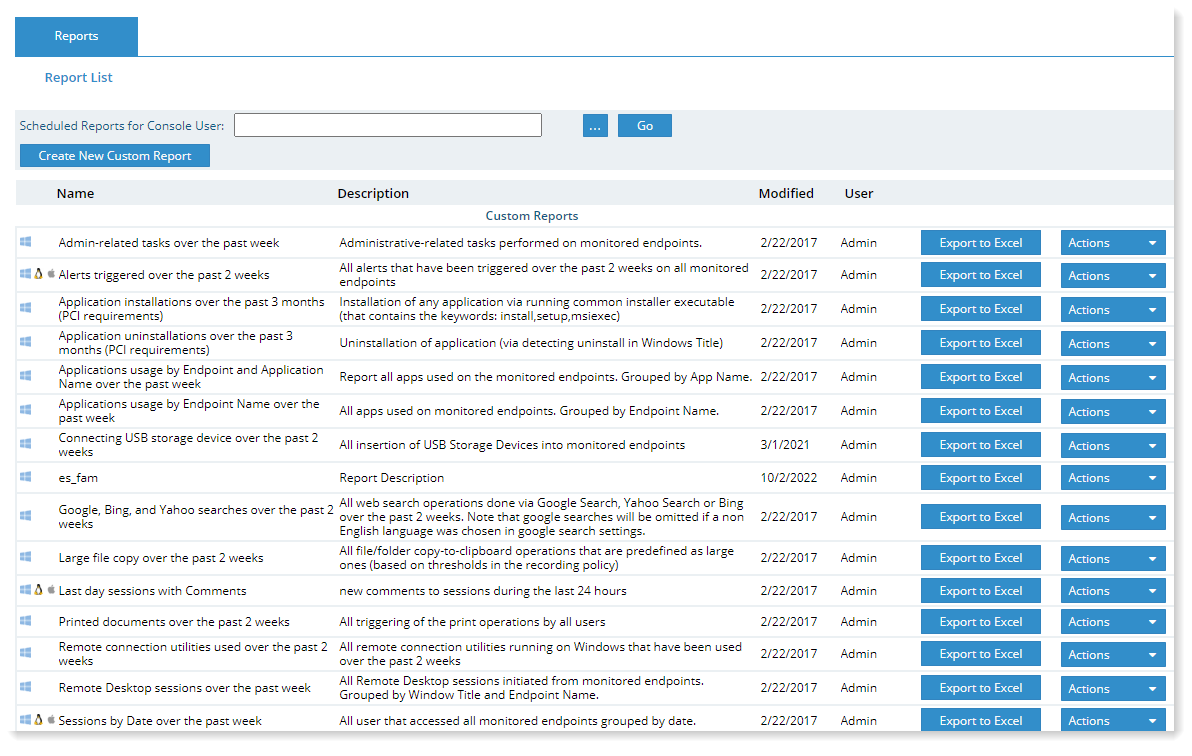
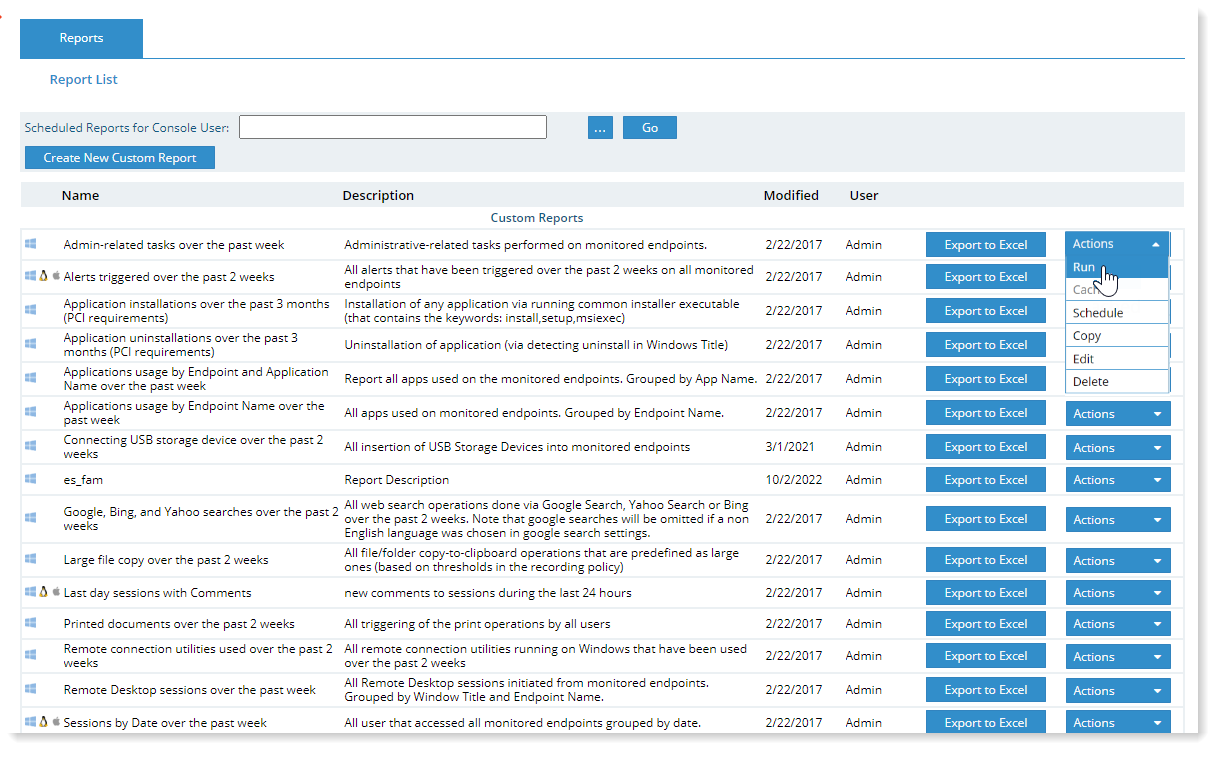
In the Reports tab, click the Run link next to the report that you want to run.
In the Reports tab, click Run from the Actions dropdown next to the report you want to run.
For example:
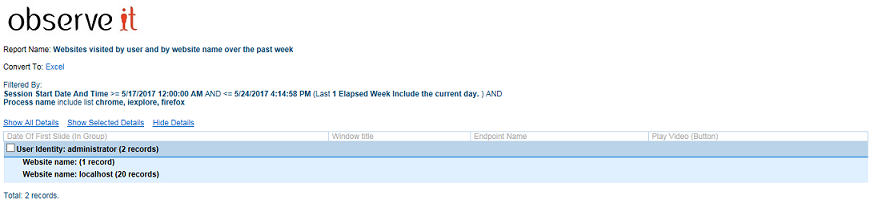
Within a short time (depending on the type and range of report), the report is generated. The results are displayed in a separate webpage, and the information can be exported to an Excel spreadsheet, as shown in the following example:
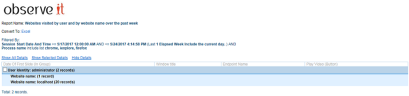
The information is displayed according to the column selection, grouping of results, session date range, and ordering of columns, that were defined during the creation of the report using the Report Configuration Wizard (see Creating a Custom Report).
-
If you want an Excel report, click Convert to Excel.
-
To view more details of the report:
- Select the group that you are interested in, and click Show Selected Details.
-Or-
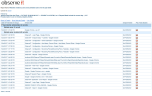
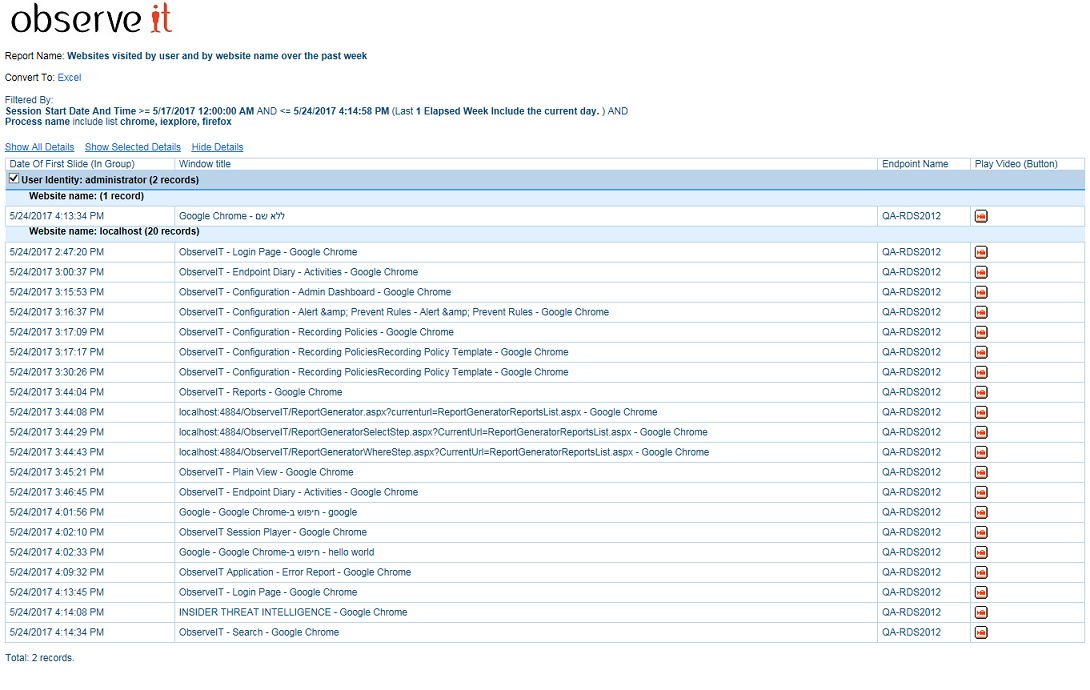
- Click Show All Details to view the details of all the items in the report, as shown in the example below.
- Select the group that you are interested in, and click Show Selected Details.
-
If the Play Video (Button) field was configured to be included in the report (see Application Report Configuration), you can replay the session from any point in time by clicking the Play Video
 icon at the right of an entry. The ITM On-Prem (ObserveIT) Session Player opens, enabling you to see, within seconds, the applications that were used, the actions that were performed by the user, and the relevance of the session to your troubleshooting process. In addition, you can see any alerts that were generated during the session (see Viewing Alerts in the Session's Video).
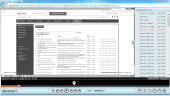


You can always return to the Report Configuration Wizard in order to add or remove columns, add or change sort-by options, add or change filters, and gradually generate the report you need by a trial and error process.