Application Activity List
The Application Activity list displayed in the User Activity Profile tab shows exactly:
-
Where users spend most of their time?
-
How much time users spend working with applications?
-
What percentage of time users interact with applications relative to other activities?
-
Details of alerts that might be triggered on the applications?
The information is displayed according to the currently defined filter. You can filter the Application Activity list to display user activity that occurred when using specific applications. For details, see Filtering the User Activity Profile Display.
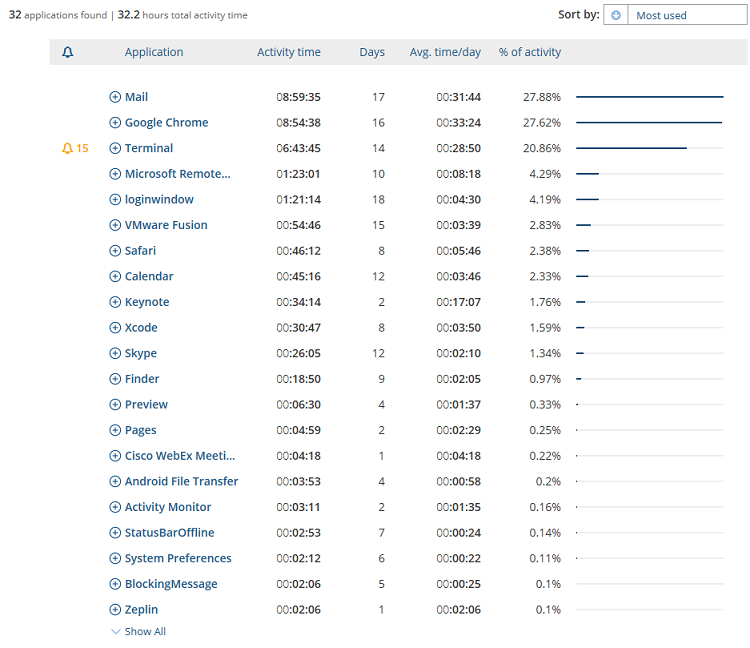
The total number of applications and total activity time in applications is displayed at the top of the list. For example: 32 applications found | 32.2 hours total activity time.
By default, applications are displayed in order of the most used applications, so that you can easily identify them. If there are more than 20 applications, a Show All hyperlink at the end of the list enables you to display all the available applications.
Each entry in the Application list displays:
-
 : An alerts bell icon is displayed if alerts were triggered for the application. The number of alert instances appears next to the icon. The bell icon color is based on the highest risk severity level (see Identifying Risk Severity Levels). Clicking the bell icon opens the Alerts page of the Web Management Console showing the relevant alerts, filtered according to the currently defined filters (computer, client, login account and secondary ID, if selected). For further details, see How Risky Applications and Alerts Contribute to the User Risk Score.
 -
Application: name of the application. Clicking the
 icon next to an application name expands the details of the application. See Viewing and Replaying Application Sessions.
 -
Activity time: the total amount of time (in hh:mm:ss format) that the user interacted with the application.
-
Days: Number of days within the selected period when there was some activity with the application.
-
Avg time/day: Average time per day (in hh:mm:ss format) that the user interacted with the the application.
- % of activity: the percentage of user activity time spent on this application out of the total user activity time for all applications in the currently filtered query. Note that this value applies to all relevant application clips according to the currently filtered conditions. For example, if the applications are filtered by a specific computer, this time will include only the time spent interacting with the application on the specific computer (within the specified time period).
The application in which most time was spent will have the largest % of activity compared to all other activities.
-
An activity bar provides a comparison of the activity time relative to all (not just the currently viewable list) other applications. The activity bar of the application with the highest total time will always be fully extended.


Sorting the List of Applications
There are a number of options for sorting the list of applications.
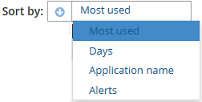
You can sort by the default option Most used, or click in the text box to open a list of other options by which you can sort the applications list:
You can sort in ascending or descending order by clicking the  or
or  buttons.
-
Most used (default): to sort by the total time spent in the application. In descending order, the most used application appears at the top of the list.
-
Days: to sort by the days of activity column.
-
Application name: to sort alphabetically according to the name of the application.
-
Alerts: to sort by the total number of alerts triggered on the application (descending order only). Applications with no alerts appear at the end of the list.