Understanding the Risky Users Display
The Risky Users area is presented under the User Behavior Change area of the dashboard. (Note that by clicking the center pane arrow  , you can collapse the User Behavior Change area enabling you to display more risky users on a page.)
In the Risky Users area of the User Risk Dashboard, you can investigate and analyze a user in detail. You can drill down into each user’s profile to explore the list of risky activities, user risk trend overtime, and other user activities. You can track users that experienced any type of policy notification or enforcement as a result of violating a company policy or security rules, and quickly pinpoint the users with the highest number of policy violations, as well as those who are not improving with time.
You can filter the display of risky users according to the criteria displayed in the list header, and sort by user risk score or other options. By filtering the risky user list according to the number of out-of-policy notifications and behavior trends (using the  option), you can easily identify users who constantly violate security policies, and those who keep ignoring these violations in spite of being warned or even blocked. For details, see Filtering and Sorting the Display of Risky Users.
The risky users and new users at risk presented in the dashboard are users that you are permitted to monitor. Some risky applications or alerts might not be displayed if you do not have permissions to view alerts based on one or more of these applications or alert rules. If you attempt to access applications which you do not have permissions to view, a lock icon appears in the User Risk Dashboard with a tooltip explaining that there was at least one risky activity in a session without permissions to view. In such a case, you should inform the Chief of Information Security (CISO) or someone who has permissions to view the data, that there is some risk for the user but you do not know what it is exactly. See also Assigning Permissions to Console Users.

Viewing Risky Users that are Anonymized
When "Anonymization" is enabled in the ITM On-Prem Web Console (see Enabling/Disabling Anonymization), personal information that identifies the user is replaced with randomly generated codes. In the User Risk Dashboard, risky users' personal photos, full names, departments, roles, and login account details are anonymized, unless specifically requested and approved to be exposed. For details, see Protecting the Privacy of Users (Anonymization).
Following is an example of a user whose personal details were anonymized:
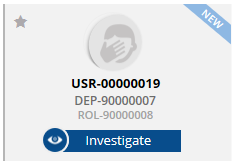
To expose a user's personal details, hover over the photo icon of the user, then click the Expose button that appears. For details, see Exposing Personal Information for Specific Users.
Expanding and Collapsing the Display of Information
For each user, you can expand or collapse the amount of information displayed, by clicking the  or
or  icons:
- In Collapsed mode, the user score and change since yesterday are displayed. A detailed tooltip displays when hovering above the user score. Active Directory information (if relevant) is hidden. The topmost three applications and their alerts are displayed in line, as shown in the following example:

- In Expanded mode, the user score, change since yesterday, and Active Directory information (if relevant) are displayed. A detailed tooltip displays when hovering above the user score. All applications and their alerts are listed. Alerts are color-coded to indicate severity. Text describing alert severity displays next to the listed alerts (for example, High, Medium, and so on), as shown in the following example:


For each risky user in the list, the following information is presented helping you to prioritize which users to investigate:
-
General information about the user, such as name, title, department and personal photo. The information displayed depends on whether or not the user is an Active Directory user (see Active Directory and Non-Active Directory Users).
-
A red tag next to a risky user's photo shows the total number of out-of-policy notifications that were displayed to the user during the last 31 days, with a trend arrow indicating whether or not the user behavior has improved over time. See Viewing Out-of-Policy Behavior.
-
User risk score: An aggregate number composed of alert risk level values assigned to alerts triggered by the user, with color breakdown of risk levels involved. A detailed tooltip displays when hovering above the user score. See Identifying Risk Severity Levels and Calculating User Risk Score.
-
List of risky applications that the user accessed and their contribution to the user’s total risk score. Clicking a risky application opens the Alerts page of the Management Console in a new browser tab, filtered by user and application. See How Risky Applications and Alerts Contribute to the User Score.
-
List and number of alerts associated with each application that contributed to the user’s total risk score. Clicking an alert opens the Alerts page of the Management Console in a new browser tab, filtered by user and alert. See How Risky Applications and Alerts Contribute to the User Score.
-
A thirty day TREND timeline chart illustrating risky user score over time. See Viewing the User Risk Score Trend.
To further examine a user's risky activities
- Click the Investigate button under the user's ID, and select Investigate alerts.
The Alerts page opens in the Web Management Console in a new browser tab. See Investigating Risky User Alerts.