Understanding the User Risk Dashboard
Viewing User Behavior and Risk Score
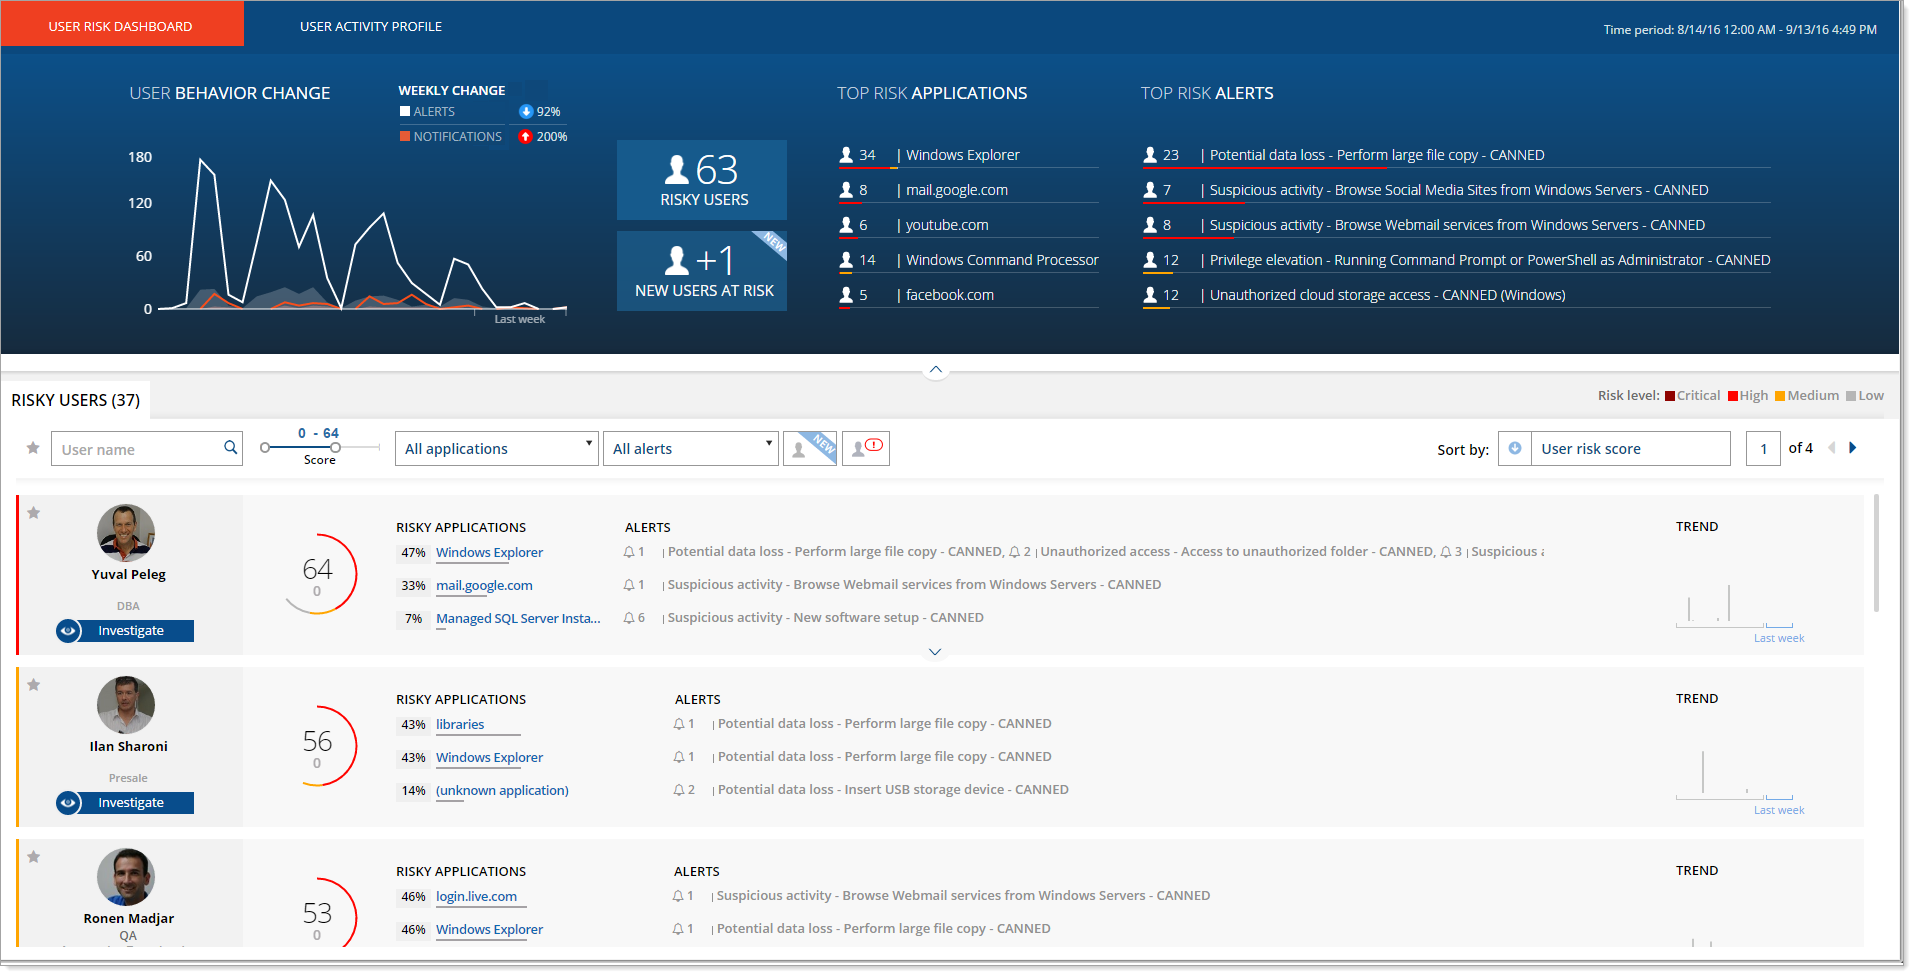
The ITM On-Prem (ObserveIT) User Risk Dashboard provides an overall view of user risk and behavior trends over a period of time. In the dashboard, you can view overall organizational risk from insider threats and view a prioritized list of users and applications that present the greatest risk to your company.
The dashboard provides a broad view of risky users and their activities. Security analysts (including security and compliance staff, and those who review insider threats, compliance, or out-of-policy risks) can quickly locate and identify risky users and new risky users. User information is graded and presented. The dashboard is divided into areas that reflect users and their actions in relation to risk. You can understand and view the overall general risk that includes the user risk level comparison, risky users, and new risky users. You can filter and sort user information, and drill down to an individual risky user's actions to view alerts, and pinpoint exactly what actions qualify them as risky users.
By default, the ITM On-Prem (ObserveIT) User Analytics service collects data on risky users and actions for a period of 31 days.
Using the dashboard, security analysts and investigators can track users that have experienced any type of policy notification or enforcement as a result of violating company policy or security rules. They can also quickly pinpoint the users with the highest number of policy violations, as well as those who are not improving with time. You can filter and sort user information according to the number of out-of-policy notifications and behavior trends, providing an easy way to identify those users who constantly violate security policies and those who keep ignoring them despite being warned or even blocked.
You can manage risk at department level using group-based permissions. This means that the information presented in the dashboard displays only the data that the currently logged-in Web Console user is permitted to monitor. For details, see Assigning Permissions to Console Users.
The following topics describe in detail the two main areas of the User Risk Dashboard:
-
Viewing Overall Risk in the Dashboard - describes the User Behavior Change area which provides an overall assessment of risk according to the number of alerts and of out-of-policy notifications generated per day,number of risky users, number of new risky users identified during the last day, most risky applications, and most risky alerts.
-
Viewing Risky Users in the Dashboard - describes the Risky Users area which provides a list of user profiles which you can investigate and analyze. You can drill down into each user’s profile to explore the list of risky activities, view the user risk trend over time, track users with the highest number of policy violations, and so on.
For a description of some of the terms and concepts used in the dashboard, see Dashboard Terms and Concepts.