Endpoint Activity View
The Endpoint Activities View lets you see all activities that occurred in user sessions on ObserveIT monitored endpoints during a specified period of time. (It is the default view in the Endpoint Diary.)
From this Endpoint Activities View you can:
-
See who last accessed a specific endpoint and view their actions. User sessions are listed in reverse chronological order, so that new sessions appear at the top of the sessions list, making them easy to identify.
-
Identify if the endpoint is running a Windows-based, Mac-based or Unix-based operating system.
-
Launch the ObserveIT Session Player, which replays the entire recorded session from beginning to end.
-
Filter what you see by time period, user and/or endpoint.
-
Show the time of the user sessions by the endpoint (local time) or by the time where the server is located.
-
View detailed information about the session as well as user activity in chronological order.
-
Export to Excel and print the User Diary Activities list.
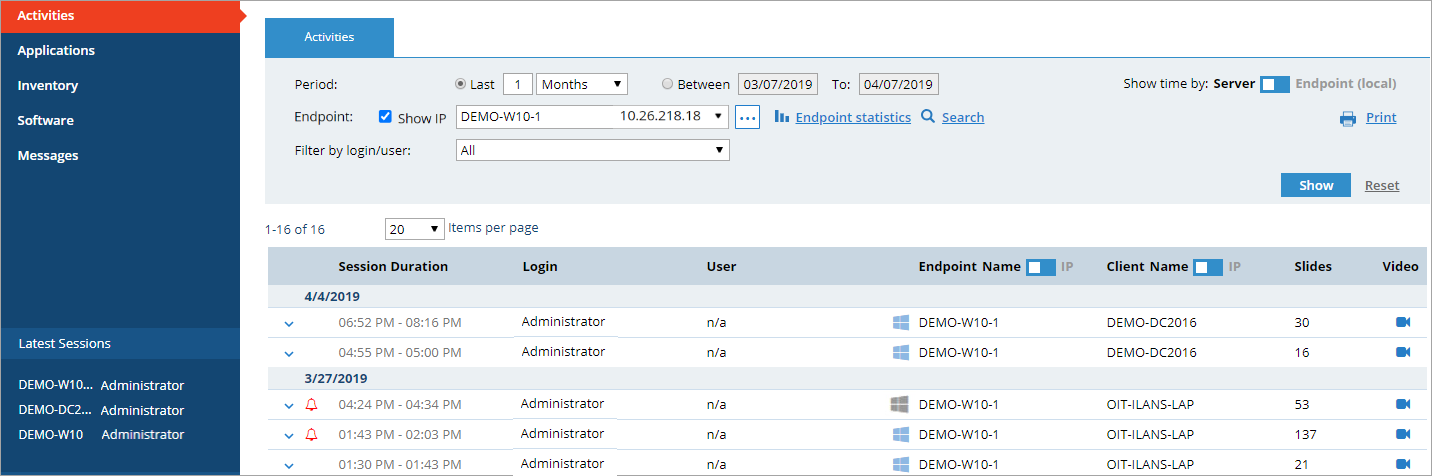
The table describes the fields in the Endpoint Activities View.
Click  for details about a selected session. See Session Details Views.
| Field | Description |
|---|---|
| Session Duration | The last activity performed by the user in the session. |
| Endpoint time zone |
The time shown is according to the endpoint time zone. |
Alert Indication  |
If alerts were generated during the session, an alert indication  is displayed showing the highest alert severity level. is displayed showing the highest alert severity level. |
| Login | The login account used to enter the session (user account used in the Windows logon process). |
| User | The actual user name used to enter the session provided by ObserveIT's Identification Services. |
|
|
The endpoint name of IP address from which the connection was made. The The difference in the icon colors indicates the status of the endpoint. |
| The client name or client IP address. | |
| Slides | The number of screenshots taken during the session (or commands in the case of Unix sessions). The warning icon  indicates the session was modified. indicates the session was modified. |
Video  |
A link to a video of screenshots with detailed session data ( for a live session). for a live session). |


If the appears the session was modified. For example, this icon would appear if a screenshot was deleted from a recorded session. Note that the warning icon will only be displayed if the Enable Session Integrity check box was selected in the Security tab of the Configuration > Security page (for details, see Securing Images on the File System ).
Filtering the Display of Sessions on a Recorded Endpoint
You can filter the display by:
-
Period: Show the activities for specific dates or for the latest days, weeks, months, or years.
-
Login: Show for all users or a specific user. The Filter by login/user is available from the Endpoint Diary tab.
-
Show time: Show time by the server location or local endpoint location. Use
 to switch between the time options. (See Showing Agent Time.)
 -
Endpoint: Show for all endpoints or a specific endpoint.
If alerts were generated during the session, an alert indication is displayed showing the highest alert severity level.
To filter, do the following:
-
Select the Period of time or date range for which you want to display the sessions.
-
From Show time by, select Server time or Endpoint (local) time.
-
Select the required endpoint from the Endpoint drop-down list.
You can also enter text directly in the Endpoint field to search for the required endpoint name or IP address or select the endpoint according to its group type or name from the Endpoint List window. You can also select the required endpoint from the Latest Sessions list at the left of the Console, which includes the most recently active sessions.
Select Show IP if you want to show the IP in addition to the endpoint name.
Clicking the Endpoint statistics link opens a window displaying statistics about the selected endpoint for the specified time period, including a breakdown of the login IDs that were used to access the endpoint, and the daily number of screen frames that were recorded by ObserveIT during user sessions on the endpoint.
Clicking the Search link enables you to see the results of search operations for the required endpoint (see Viewing Search Results).
-
From the Filter by login/user drop-down list, select the login name or user or search for the required one.
-
Click the Show button to refresh the page to display all the user activities that occurred on the specified endpoint.
By default, the page shows up to 20 activities; you can change the default by selecting 50 or 100 from the Items per page drop-down list above the table.