Viewing a List of Alerts
In the Alerts page, you can view the names, user risk level, applied action (if defined in the alert rule), and status of all triggered alerts, with the newest alerts at the top (organized by date/time and color coded per risk level). You can expand an alert row to view more details (including the conditions which triggered the alert).
You can export the Alerts list to Excel and/or print it (see Exporting and Printing the Alerts List). Alerts can be deleted ONLY by ObserveIT Administrators (see Deleting and Restoring Alerts).
To view a list of alerts
- Click the Alerts tab.
The Alerts page opens in List view which is the default mode.
- To switch to List mode from another viewing mode, click the List
 icon in the Show area of the Alerts page.
In List mode, you can view a list of alerts that are already configured according to the specified filter criteria. One line of information is shown about each alert.

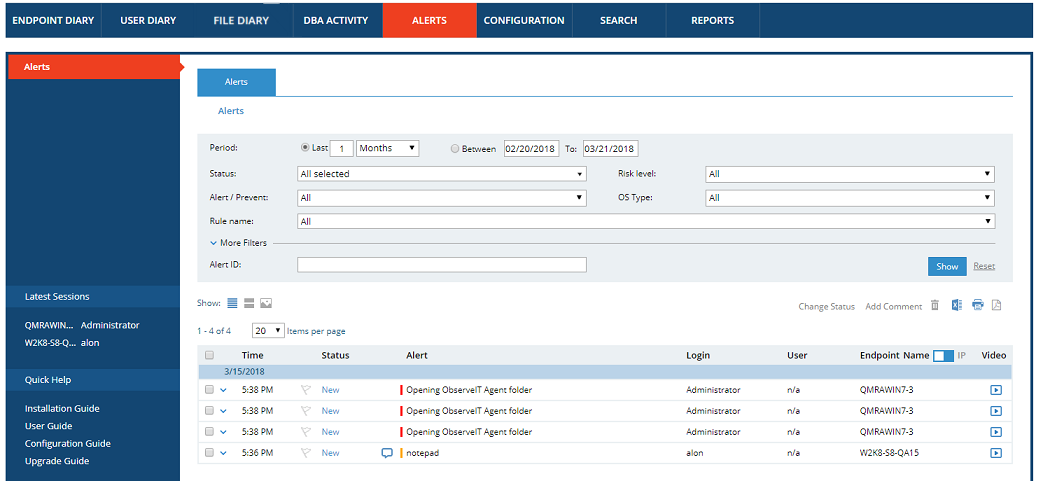
Above and to the right of the list, the following hyperlinks and icons enable you to:
| Link/Icon | Description |
|---|---|
|
Change Status |
Click this link in order to change the status of selected alerts. See Changing the Status of Alerts. |
|
Add Comment |
Click this link to add a comment to selected alerts. See Adding Comments to Alerts. Note: You can select a single alert, multiple alerts, all the alerts on the current page, or all the alerts on ALL pages. |
|
|
Delete selected alerts. See Deleting Alerts. Note: Alerts can only be deleted by ObserveIT Administrators. |
|
|
Export the Alerts list to Excel. See Exporting and Printing Alerts. |
|
|
Print the Alerts list. See Exporting and Printing Alerts. |
|
|
Export selected alerts to a PDF file. See Exporting Alerts to a PDF File. |


For each alert in the list, the following information is displayed according to the "filtered" details (see Filtering the Alerts Display):
| Field/Icon |
Description |
|---|---|
|
|
Click to select the alert. |
|
|
Click to show details of the alert. See Viewing Alert Details. |
|
Time |
Time that the alert was triggered. Alerts are generated as close as possible to the time they occur. In case of a delay between the alert generation and the time of reporting it (such as, Agent offline, communication issues, and so on), the date and time of the alert reflects the time it was generated, regardless of the delay. |
|
Flag icon |
Indication of whether the alert is currently flagged for follow-up. |
|
Status |
Current status of the alert: New, Reviewing, Issue, or Non-Issue. You can change the status of a selected alert(s) by clicking the Change status link. A popup enables you to select a different status. If you change the status to Non-Issue, the user risk score will be reset. |
|
Icon |
Indicates the type of action configured for the alert when triggered:
The above icons appear grayed out if the action was not applied on the end user. |
|
Colored bar |
Indicates the user risk level of the alert:
|
|
Alert |
Name of the alert that was triggered. For example, "After-hours login to DB server". |
|
Login |
Login name of the user who ran the session in which the alert occurred. |
|
User |
Secondary identification of the user who ran the session in which the alert(s) occurred. |
|
Endpoint |
Server on which the alert occurred. |
|
Video icon |
When the video icon is clicked, the Session Player opens at the screen location where the alert was generated. See Replaying User Sessions. |


