Monitoring Overall System Health (Admin Dashboard)
System Health Monitoring
ITM On-Prem (ObserveIT) provides comprehensive monitoring of all system components, providing administrators with a high-level system health overview, along with drill-down capabilities to quickly investigate any issues. An Administrative Dashboard presents administrators with graphical summaries of the operational statuses of installed ITM On-Prem (ObserveIT) Agents and Infrastructure, enabling you to see at-a-glance any issues requiring attention, such as communication faults, data loss, dwindling disk space or Agent tampering. Most Dashboard elements can be clicked to drill down into the details of that element.
The Admin Dashboard provides graphical summaries of the operational statuses of installed ITM On-Prem (ObserveIT) Agents and infrastructure (Application Servers, and so on), and easy navigation to drill down and perform root-cause analysis and corrective action. The Admin Dashboard enables you to see at-a-glance all the active Agents that are currently installed. ITM On-Prem (ObserveIT) administrators can quickly identify events and statuses across the system and respond accordingly. Operational statuses and system events are color-coded according to severity (for example, "red" is the highest severity which might require immediate attention). Every change on a local Agent triggers a system event. Events that are "normal" (with OK status) would probably not require attention (for example, when the Agent service is started).
The easy-to-use Admin Dashboard provides a quick overview of system health—just two clicks away from understanding the specific Agent event that occurred due to tampering or other errors (see Walkovers: Two Steps to Agent Health).
A mini Admin Dashboard (located at the upper left part of the Web Console) is viewable from every page in the Web Console. It provides a quick preview of the Agents' operational statuses and quick access to the full Admin Dashboard.
For details, see Mini Admin Dashboard.
ITM On-Prem (ObserveIT) administrators can access the Admin Dashboard by navigating to the Configuration > Admin Dashboard tab of the Web Console, or by clicking the mini Admin Dashboard.
If configured as the default user page, the Admin Dashboard will open by default when the user logs on to the Web Console. See Creating and Managing Local Console Users.
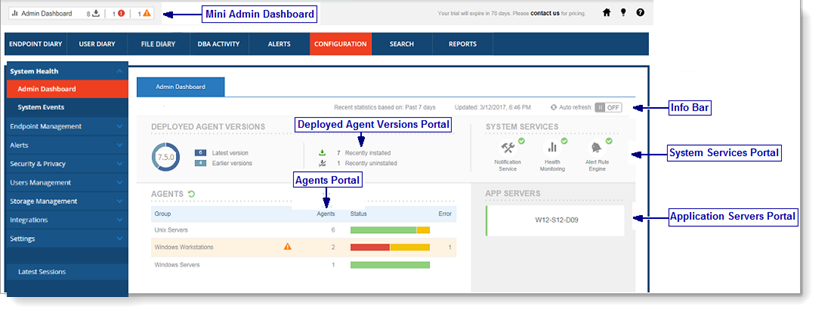
The portals of the Admin Dashboard provide system health status information and easy navigation to investigate further details:
-
Agents: displays a list of Agent groups, the number of Agents in the group, colored-coded statuses of the Agents, and the number of Agents that have errors (if any).
The Agents portal displays all the active Agents that are currently installed. Agents that were recently uninstalled or unregistered are not included.
-
If any of the Agents in an Agent group were tampered with and/or experienced data loss within the past 7 days, the relevant row is marked with the Tampered With
 icon and/or Data Loss
 icon, each icon displaying a tooltip that indicates the last date of occurrence. The row marked by is shaded orange to easily identify which Agent group was tampered with. The shades of orange and blue on the icons vary according to how recently the tampering or data loss occurred—the darkest shades
 indicate the current day, the medium shades
 indicate the past 2-3 days, and the lightest shades
 indicate earlier in the week.
-
You can click the Agent group name, the colored statuses, the error numbers, and icons, to obtain further details.
Admin users can click the Reset icon
 next to Agents in order to reset all the Agent statuses to OK (green).
-
-
App Servers: displays a list of Application Servers and their statuses. Application Servers that are active and functioning normally have a green severity level and OK status. You can click an Application Server to view details of the system events associated with the server.
-
Deployed Agent Versions: displays the current Agent version, the number of Agents that are running the latest software version and earlier software versions, and the number of Agents recently installed/uninstalled within the last 7 days. You can click the Latest/Earlier version links, and the Recently installed/uninstalled links and icons to view further details about the deployed Agents.
-
System Services: displays information about the statuses of the Notification Service, Health Monitoring Service, and Alert Rule Engine Service, whether OK (marked by
 ) or with errors (marked by
  ). You can click each service icon to view further details.


The Info Bar at the top of the dashboard provides the following information and functionality:
-
Recent statistics based on: shows the time period (past 7 days) on which the various statistics displayed in the dashboard are based.
-
Updated: shows the last date and time the data in the dashboard was updated (refreshed).
-
Manual/Auto refresh: provides a Refresh
 button to manually refresh the page, an Auto refresh button, and options to automatically refresh the page (every 5, 10, or 15 minutes).

Workflow for ITM On-Prem (ObserveIT) Health Monitoring
The following steps outline a typical scenario for monitoring the health of the ITM On-Prem (ObserveIT) system:
-
Receive notification that health status has changed—via the mini Admin Dashboard and email notification (see Mini Admin Dashboard and Configuring Email Notification Settings for Events).
-
View the Admin Dashboard to analyze component statuses.
-
Pinpoint the components experiencing events: Agent group, Application Server, or system service (see Agents, Application Servers, and System Services).
-
Focus on an ITM On-Prem (ObserveIT) component and investigate status details and causes.
-
Drill down to the Agent to assess its operational status details (see Drilling Down to Agent Details).
-
Investigate Agent system events to understand the root cause (see Investigating System Events).
-
Integrate system events into the organization's existing SIEM system (see Integrating ITM On-Prem (ObserveIT) Logs into SIEM Systems).