User Activity Over Time Graph
The User Activity Over Time graph provides an overall view of user activity during the profile time period.
Profile data is collected on a daily basis starting from the date displayed at the top right corner of the User Activity Profile page.
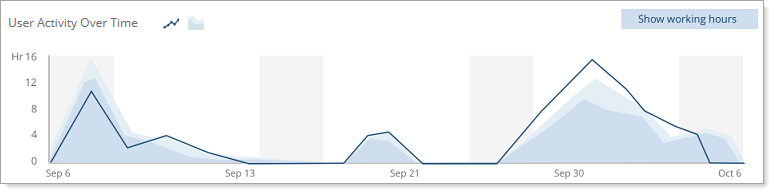
By default, User Activity Over Time is presented by 3 graphs:
-
Activity time graph (presented by the dark blue line): aggregated daily user activity time spent on all applications during the selected period and within the current filter.
- Two area graphs appear as a "background" for the Activity time line graph.
Working time (area graph including both colors): shows the time elapsed between the first and last user activity for each calendar day. A user’s daily working period is fixed and is not influenced by filters. Note that idle time (i.e., time of no activity) is included.
Idle time (top area color): shows the time (out of the Working time) that the user did not perform any activity. The user might still be working (e.g., phone calls, meetings) but did not interact with any recorded applications.
Note: The Working time and Idle time graphs reflect the summary statistics displayed above the graph. For details, see Viewing a User's Activity Profile.
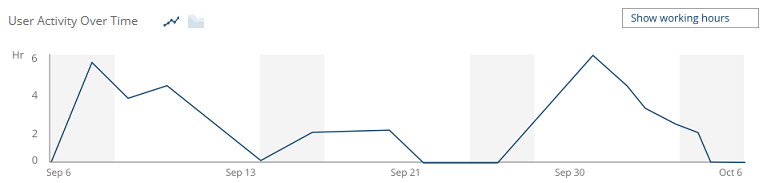
The "background" graphs are displayed by default. Clicking the Show working hours button enables you to to hide the "background" graphs so that the main activity time graph can be viewed in full scale, as shown below:
Clicking the Show working hours button again restores the default graph display.
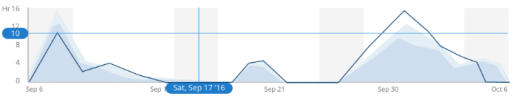
- When hovering over the User Activity Over Time graph, cross coordinates (with X and Y axes) appear showing:
X: the day and date
Y: the Hours value
- When the cross coordinates meet on a point on the graph, the exact day and date of the activity is displayed, for example, Sat, Sep 17 '16.
You can configure the day on which a week begins in the System Settings page (for details, see Configuring System Settings). If the week begins on Monday, the weekend is Sat-Sun; if the week begins on a Sunday, the weekend is Fri-Sat. In the User Activity Over Time graph, weekends are indicated by a gray background.

Icons
A line icon and an area graph icon displayed above the graph show:
|
|
Activity time: Aggregated daily user activity time spent on all applications during the selected period and within the current filter. |
|
|
Working time: Time lapse between the first and last user activity for each calendar day. A user’s daily working time is fixed and is not affected by any filters. The top area of the graph indicates idle time (i.e., time of no activity). Idle time is included in overall Working time. |

