Viewing Alert Details
In Details mode, you can view details of the conditions that contributed to the generation of the alert. You can see exactly "Who?" "Did what?" "On which computer?", "From Which client?" and "When?".
For details of the conditions and instructions on how to configure alert rules, see Creating and Editing Alert Rules.
To view the alerts in Details mode
- In the Show area of the Alerts page, click the Details
 icon.
icon. The Details mode displays the expanded details for each alert (same as if you clicked
 to expand each list view item).


Note the following:
-
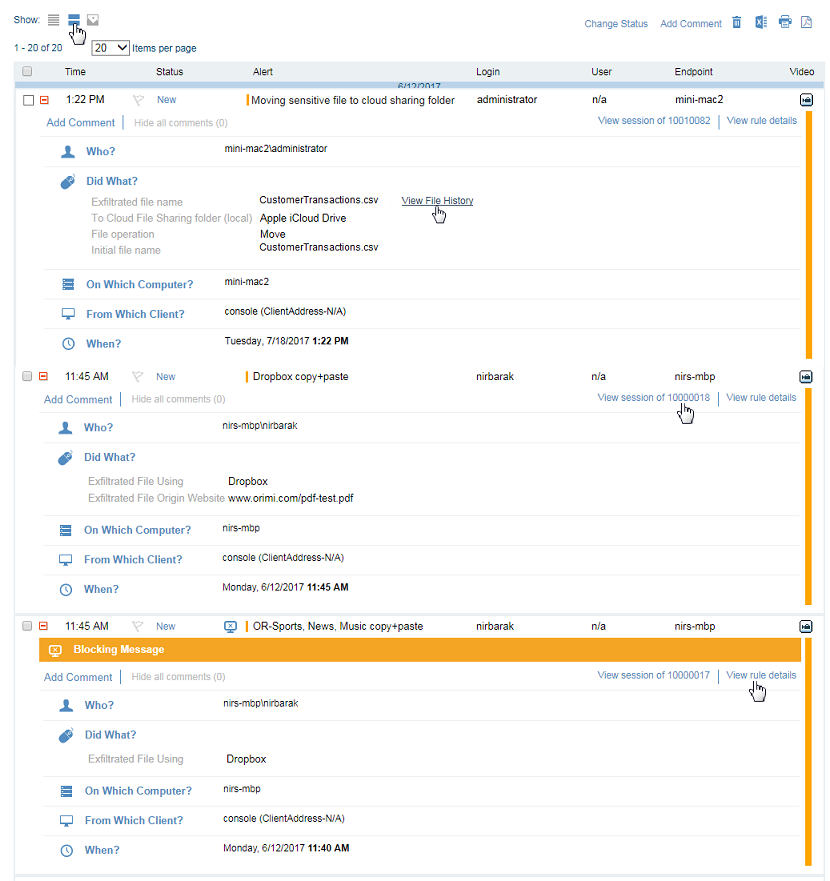
When File Activity monitoring is enabled, and a Data Exfiltration category alert was generated as a result of user actions on a tracked file or folder, clicking the View File History link (shown in the above screenshot) enables you to see all the actions and events that occurred on the tracked file. For details, see File History View.
-
If an action was configured for the alert (see Defining Actions for Alert Rules), the details show the action type as the header, such as Blocking Message (as shown above), as well as any text feedback that was provided by the end user.
-
You can add comments relating to the alert by clicking Add Comment. Any comments that were added for the alert will be displayed, unless the Hide all comments link is selected. For details, see Adding Comments to Alerts.
In Details mode, you can view the details of the conditions that contributed to the generation of the alert, as follows:
| Section | Description |
|---|---|
|
Who? |
Who is the user on which the alert will be generated? |
|
Did What? |
What actions did the user do? For example, you can see which URLs the user visited, which applications they ran, user actions on tracked files (when file monitoring is enabled), uploads of tracked and non-tracked files, and so on. |
|
On Which Computer? |
Name of the computer on which the action occurred. |
|
From Which Client? |
Name of the client domain\name or client IP address. |
|
When? |
What day/date/time did the action occur. In case of a delay between the alert generation and the time of reporting it (such as, Agent offline, communication issues, and so on), the date and time of the alert reflects the time it was generated, regardless of the delay. |
|
View session of |
Click the View session of link in the alert details to open the Search tab showing the session containing the alert with the specified ID (see Searching for Sessions by Alert ID). |
|
View rule details |
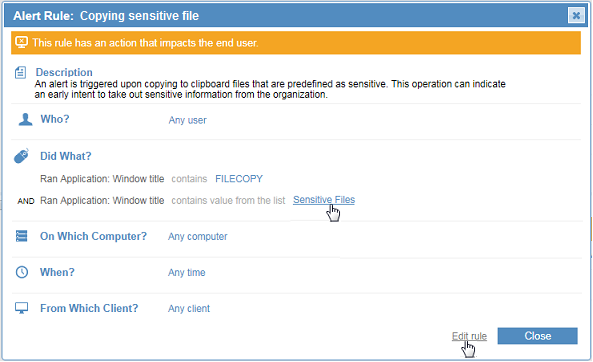
Clicking the View rule details link opens a popup window displaying the alert rule conditions, with additional configuration options:
If an action was configured for the alert rule, a warning is displayed that the rule has an action that impacts the end user. For example:
|