Filtering the Alerts Display
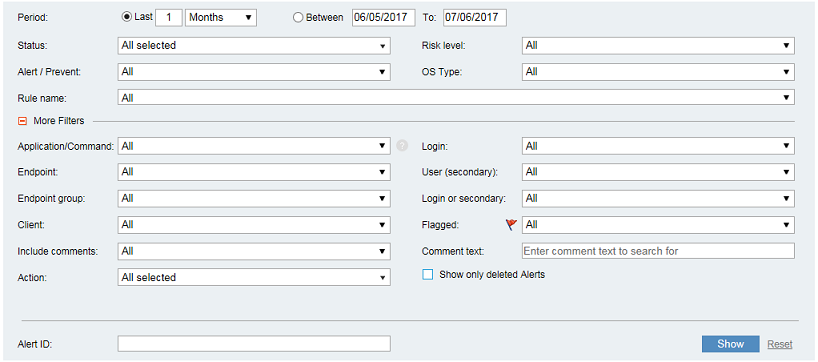
In the Alerts page, you can filter the alerts that are displayed according to the following criteria:
-
Time period or date range during which the alert(s) occurred.
-
Time zone, either time zone of the endpoint or time zone of the server. Use
 to switch between time zones. (See Showing Agent Time.)
 -
Status of alerts. Options are New, Reviewing, Issue, or Non-Issue. For details, see Changing the Status of Alerts.
- Risk level of alerts. Options are as follows:
Critical: The highest severity level for an alert, with dark red
 risk level color indicator. Select this option to view alerts that are generated on critical risk users.
 High: High severity alerts, with red
 risk level color indicator. Select this option to view alerts generated on high risk users.
 Medium: Medium severity alerts, with orange
 risk level color indicator. Select this option to view alerts generated on medium risk users.
 Low: Low severity alerts, with gray
 risk level color indicator. Select this option to view alerts generated on low risk users.
-
Alert/Prevent: The type of rules that contributed to the alerts that you want to view. Options are Alert Rules, Linux Prevent Rules, or All to view alerts for both types of rules.
-
OS Type: The operating system of the machine on which the alerts were defined. Options are: Windows/Mac, Unix, or All (Windows/Mac and Unix).
- Rule name: The unique name of the alert rule.


If required, you can further filter your alerts display according to the following additional criteria:
|
Filter |
Description |
|---|---|
|
Application/Command |
Use to search for alerts generated for a specific application or domain (for web applications) on Windows, or a specific command on Unix. Select a specific application/domain/Unix command from the list, or select All to search for all applications or commands. |
|
Endpoint |
To search for alerts by the endpoints on which the alerts occurred, select a specific endpoint from the list, or select All to view all alerts. See Viewing Endpoint/Client Names and IP Addresses. |
|
Endpoint group |
To search for alerts by the endpoint group which includes the servers on which the alerts occurred, select a specific endpoint group (Active Endpoints, Unix Servers, or Windows Servers) from the list, or select All to view all alerts. |
|
Client |
To search for alerts by the client computer from which the user who ran the session logged in, select a specific client from the list, or select All to view all alerts. |
|
Include comments |
To search for alerts according to whether or not they have comments, select the required option (Alerts withcomments/Alerts without comments), or select All to view alerts with and without comments. |
|
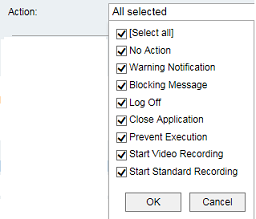
Action |
To search for alerts according to specific actions that should be taken when the alert is triggered, select the required option(s) from the list, or Select all to view alerts with all types of actions, then click OK.
For details, see Defining Actions for Alert Rules. |
|
Login |
To search for alerts by the login name of the user who ran the session in which the alerts occurred, select a specific login name from the list, or select All to view all alerts. |
|
User (secondary) |
To search for alerts by the secondary identification of the user who ran the session in which the alerts occurred, select a specific user name from the list, or select All to view all alerts. |
|
Login or secondary |
Use to search for alerts by user login name or secondary identification. |
|
Flagged |
Use to search for alerts by whether they were flagged or not flagged select Yes (flagged) or No (not flagged), or select All to view all events. |
|
Comment text |
Use to enter comment text by which you can search for alerts with comments. This field is unavailable if you selected the Alerts without comments filter. |
|
Show only deleted alerts |
Select this check box to display only alerts that were previously deleted. For details, see Deleting and Restoring Alerts. |
To filter the alerts displayed in the Alerts list
- In the Period field, specify the time period (Last) or a date range for your search (Between).
-
From the Status drop-down list, select the current status of the alert(s) that you want to view: New, Reviewing, Issue, or Non-Issue. You can select All to view alerts with any status.
-
From the Risk Level drop-down list, select the severity level of the alert(s) that you want to view: Critical, High, Medium, or Low. You can select All to view alerts with any severity level.
-
From the Alert/Prevent drop-down list, select type of rules that contributed to the alerts that you want to view: Alert Rules or Prevent Rules. You can select All to view alerts for both types of rules.
-
From the OS Type drop-down list, select the operating system of the machine on which the alerts were defined: Windows/Mac, Unix, or All (Windows/Mac and Unix).
-
From the Alert rulename list, select the alert rule that you want to view (or select All to view all alerts).
-
Expand the More Filters section by clicking
 to filter the alerts displayed according to additional criteria, as described above.
 -
In the Alert ID text box, type the ID of the particular alert that you want to view. (Note that you can only search for an alert according to its exact alert ID.)
- When you have finished defining your search criteria, click Show to update the Alerts list according to the specified details. See Viewing a List of Alerts.
To clear the filter fields, click Reset.